
Bosai Solution ID : JBP00119
Utilization of satellite SAR data -Estimation of subsurface conditions based on ground surface deformation obtained by satellite SAR-
Estimation of subsurface deformation by inverse analysis using finite element method (FEM)
Hazard
Solution Purpose
Solution Theme
Research & Investigation
Risk Assessment
Disaster Prevention Plan
Infrastructure Technology
Information & Communication Technology
Technology Subject
Advantages
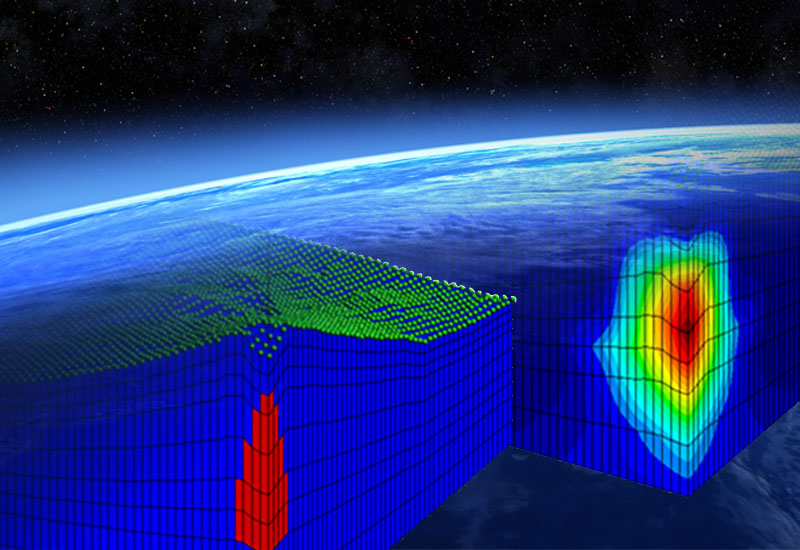
Using ranging data obtained by Synthetic Aperture Radar (SAR) -equipped satellites, ground surface deformation can be measured. In addition, by combining inverse analysis technology, we can estimate the subsurface strain conditions that cause land surface deformation. This is useful for analyzing landslides, embankment deformation, and surface subsidence.
Solution Illustrated
Interferometric SAR analysis is a method of studying the deformation of the earth's surface using satellite SAR. Each time a satellite passes through the same orbit, the phase of the radio wave reflected from the earth's surface is measured. If the ground surface is rising, for example, the distance from the satellite changes and a phase difference is generated. From this phase difference, the amount of deformation of the ground surface is determined.
The obtained deformation of the ground surface is regarded as the deformation of the top surface of the analytical model, and changes in the strain distribution inside the model and areas of reduced stiffness are estimated by inverse analysis.
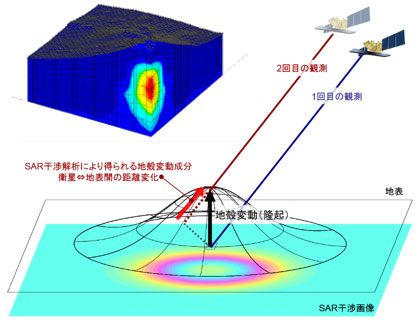
Note: Figure modified from the phase diagram, "What is Interferometric SAR/SAR Interferogram?" available from Geospatial Information Authority of Japan's website: https://www.gsi.go.jp/uchusokuchi/sar_mechanism.html
The obtained deformation of the ground surface is regarded as the deformation of the top surface of the analytical model, and changes in the strain distribution inside the model and areas of reduced stiffness are estimated by inverse analysis.
Note: Figure modified from the phase diagram, "What is Interferometric SAR/SAR Interferogram?" available from Geospatial Information Authority of Japan's website: https://www.gsi.go.jp/uchusokuchi/sar_mechanism.html
Background
Deformation of the earth's surface can be detected using satellite SAR. However, estimating the cause of the deformation requires the strain distribution in the ground that caused the deformation, which can be obtained by inverse analysis using a 3D FEM with a Kalman filter.
Exposition of the Solution
Once surface deformation is obtained, Geolab's inverse analysis software, Geo-Inverse, using the FEM allows investigation of changes in physical properties and strain occurred in the subsurface.
To evaluate the performance of the inverse analysis, the model shown in Figure 1 is prepared. Assume a region of volume shrinkage inside the model (red in Fig. 1). Figure 2 shows the deformation of the ground surface caused by this shrinkage strain.
This is the ground surface deformation obtained from satellite SAR measurements. An inverse analysis is performed with this deformation as a known and the area and magnitude of the strain changes as an unknown.
Figure 3 shows the shrinkage area obtained from the inverse analysis. Figure 4 compares the measurement and identification results, which are on a straight line with a slope of 1, indicating the accurate reproducibility of measurement results by the identification results.
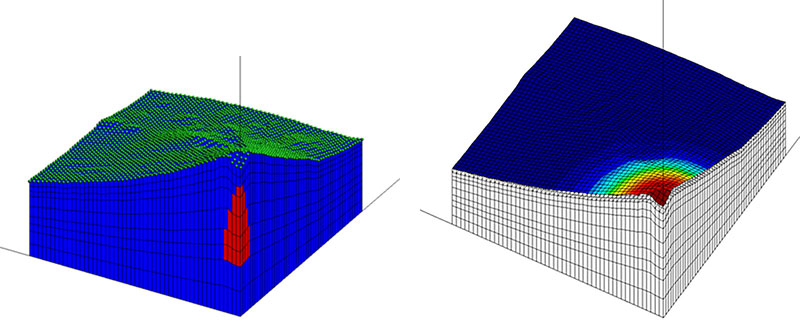
left side:Fig. 1 Mountain and shrinkage area (indicated by red).
right side:Fig. 2 Ground surface displacement contour obtained by inverse analysis.
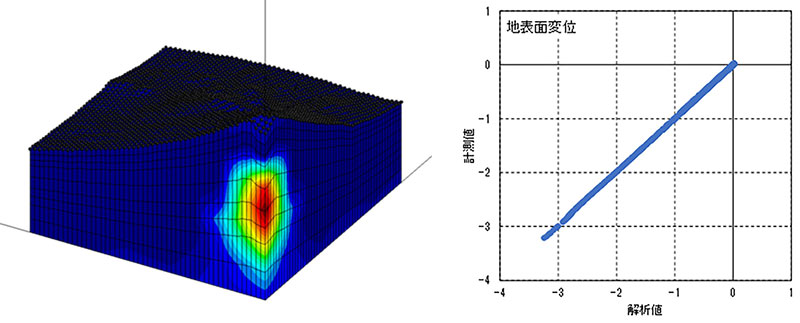
left side:Fig. 3 Shrinkage contour obtained by inverse analysis.
right side:Fig. 4 Correlation between measurements and results obtained by inverse analysis.
In Figs. 3 and 4, warmer colors indicate greater changes.
To evaluate the performance of the inverse analysis, the model shown in Figure 1 is prepared. Assume a region of volume shrinkage inside the model (red in Fig. 1). Figure 2 shows the deformation of the ground surface caused by this shrinkage strain.
This is the ground surface deformation obtained from satellite SAR measurements. An inverse analysis is performed with this deformation as a known and the area and magnitude of the strain changes as an unknown.
Figure 3 shows the shrinkage area obtained from the inverse analysis. Figure 4 compares the measurement and identification results, which are on a straight line with a slope of 1, indicating the accurate reproducibility of measurement results by the identification results.
left side:Fig. 1 Mountain and shrinkage area (indicated by red).
right side:Fig. 2 Ground surface displacement contour obtained by inverse analysis.
left side:Fig. 3 Shrinkage contour obtained by inverse analysis.
right side:Fig. 4 Correlation between measurements and results obtained by inverse analysis.
In Figs. 3 and 4, warmer colors indicate greater changes.
Achievements of Examples
Geolab is currently working on case studies on landslides.
Corporate Profile
Geoscience Research Laboratory
JM Bldg.4F, 3-1-6 Yamatohigashi, Yamato, kanagawa, 242-0017, Japan
Tel. : +81-46-200-2281
E-mail : chisoukengeolab.jp
Website : https://www.geolab.jp/